We come across this situation a lot when we see drops in QOS classes and continuous increase in “Total Output drops” on interfaces but for sure our traffic never crosses CIR rate which ISP provides. This quizzes mostly every network engineer many times in their career.
You would see something like this:
Router#show interface ten0/0
TenGigabitEthernet0/0 is up, line protocol is up (connected)
 <----SNIP--->
 Input queue: 0/75/0/0 (size/max/drops/flushes); Total output drops: 12020
<----SNIP---->
If you see QOS outputs in most of the cases you would see queue related drops :
Class-map: child1 (match-all)
 288257 packets, 409102610 bytes
 30 second offered rate 1397000 bps, drop rate 0342 bps
 Match: access-group name TEST
 Queueing
 queue limit 64 packets
 (queue depth/total drops/no-buffer drops) 10/10023/10023
 (pkts output/bytes output) 288234/409072332
 bandwidth 70% (1400 kbps)
So basically what is happening here is we are seeing a burst of traffic hitting to the router and router resources are not able to contain it. Lets understand it in simpler term. Suppose you have CIR rate of 10 packets per second for a class , but you know that there can be a situation when there can be 11-15 packets coming to egress out of the interface in that class. So to contain anything more than a 10packet/second you have kept a buffer which can queue upto 5 packets for some sub seconds.Also we are assuming that all the other classes are fully utilized and there is no bandwidth available to share between classes. Now if we receive 10 packets we are well within CIR rate and we transmit it, if we receive 12 packets we have crossed the CIR for the class (You might not have crossed overall CIR rate on that interface) but still we have space left in our buffer so we queue 2 packets in the buffer, and the router after sending out those 10 packets picks up the packet in queue and send it out. Now again, lets assume we have received a burst of 20 packets per second, we can send 10 packet per second and store 5 packet in the buffer but what about the other 5 packet ? Unfortunately, it gets dro pped and our “no-buffer drops ” and “total drops” gets incremented by 5. The queue situation will look like this.
(queue depth/total drops/no-buffer drops) 5/5/5

Queue depth -> packets which are in the buffer right now
Total drops -> CIR drop and Queue drops
no-buffer Drops-> Queue full drops
So we have covered the back ground of burst, now lets see how we can identify this with the help of wireshark.
It is simple to get the burst identified in the wireshark capture. Following is the step.
- Capture the right data, for example you are seeing drops in a particular class. Capture data for only that class or use proper wireshark filer to get the packets which should be hitting to the class which we need to investigate.
- Once you have the proper packets identified, then in wireshark go to statistics >I/O graph
- Click on I/O graph and you will see a window pop up which will tell you packets per second, like below

Here we are very clearly seeing the spike in packet packet per second which is going from less than 100 to 700 packets within seconds. You can see the “interval” at the bottom, you can change the interval to to get more granular data in miliseconds so lets see how many packets we were seeing in miliseconds.
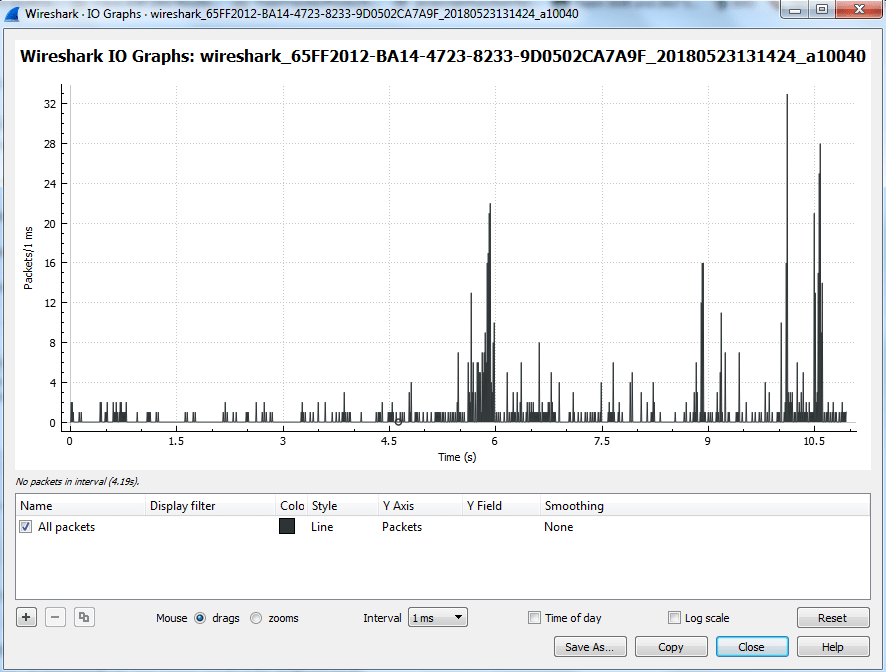
Looking at graph we know that we have few fairly long bars where packets per milisecond was more than 30 packets. If the CIR rate on the router was 10 Packets per second and the buffer length was 5 packets then definitely we were dropping 15 packets for that interval.
I will cover how to identify top talkers in your network with the help of wireshark in my next blog.
Thanks for visiting my blog, please share your thoughts in comments section.
Stay tuned for more.
[…] blog about identifying if there is a microbursts in the network or not. If not please visit the post as this one is just an extension from the old […]